Cyber Security
Identify high-priority database anomalies and choose which one to investigate with actionable solutions.
Anomaly Detection Overview
Polar Systems

Node Graph
Polar Systems
Detailed Host Insights
Polar Systems
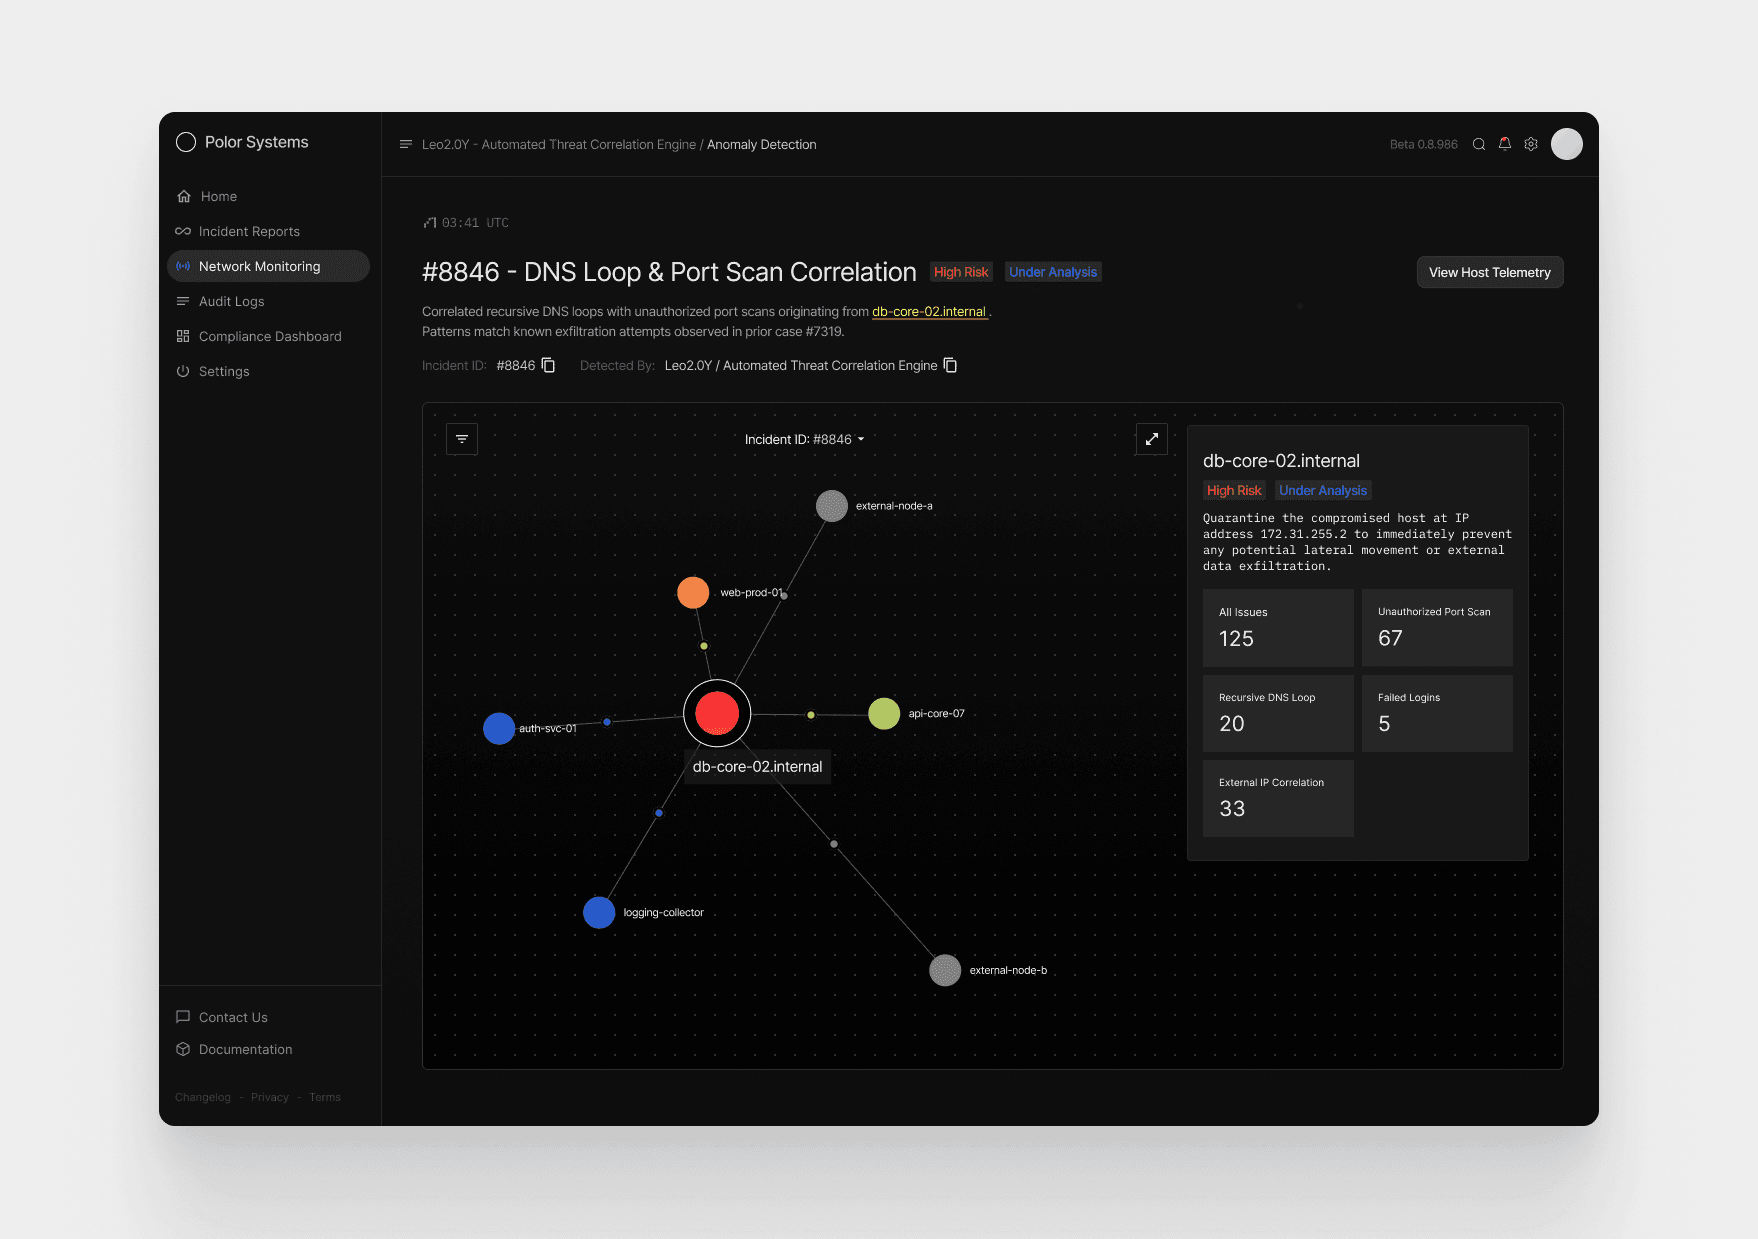
When the analyst opens the database anomaly catalog, they immediately spot a critical alert on db-core-02.internal—a correlated DNS loop paired with unauthorized port scans tagged as Case #8846.
Recognizing the unusual pairing, they drill into the anomaly and reveal a network relationship map showing three internal nodes behaving abnormally, two external nodes tied to the scans, and even a prior connected incident (#7319) linked to the same subnet. The deeper they look, the clearer the compromise becomes: port-scan spikes, recursive DNS loops, failed login attempts, and cross-system correlation hits confirm the threat’s scope.
With this context, the system surfaces actionable steps—correlate logs, generate a summary, replay the captured traffic, or isolate the host—giving the analyst everything needed to quickly contain the intrusion and begin full remediation.
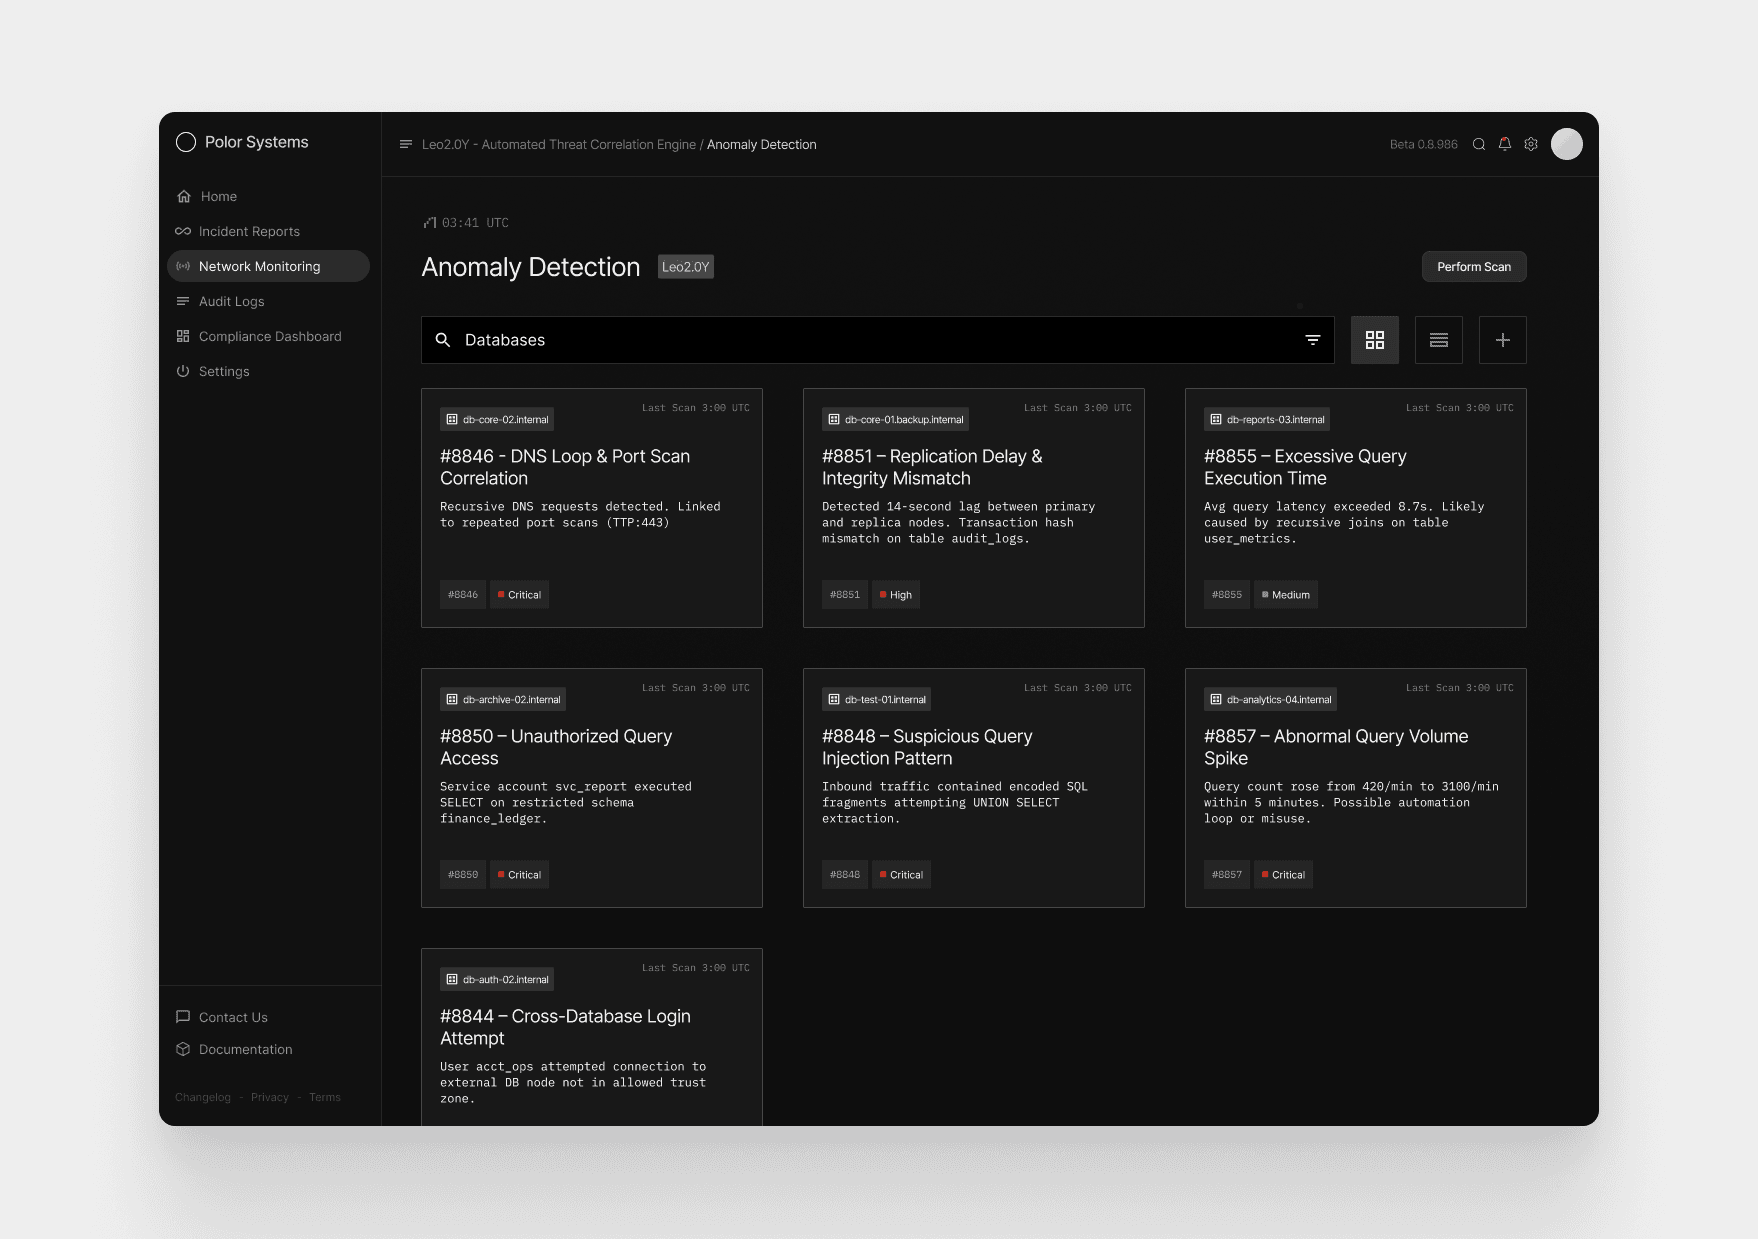
Anomaly Detection Overview
Purpose: Quickly identify high-priority anomalies across all monitored database servers and choose which one requires immediate investigation.
The first screen presents a catalog of correlated database anomalies, each represented as a card generated by Leo2.0Y, the threat-correlation engine.
This screen is designed so an analyst can immediately scan the grid, recognize severity patterns, and spot unusual combinations—such as DNS recursion linked with port scanning—without sifting through raw logs.
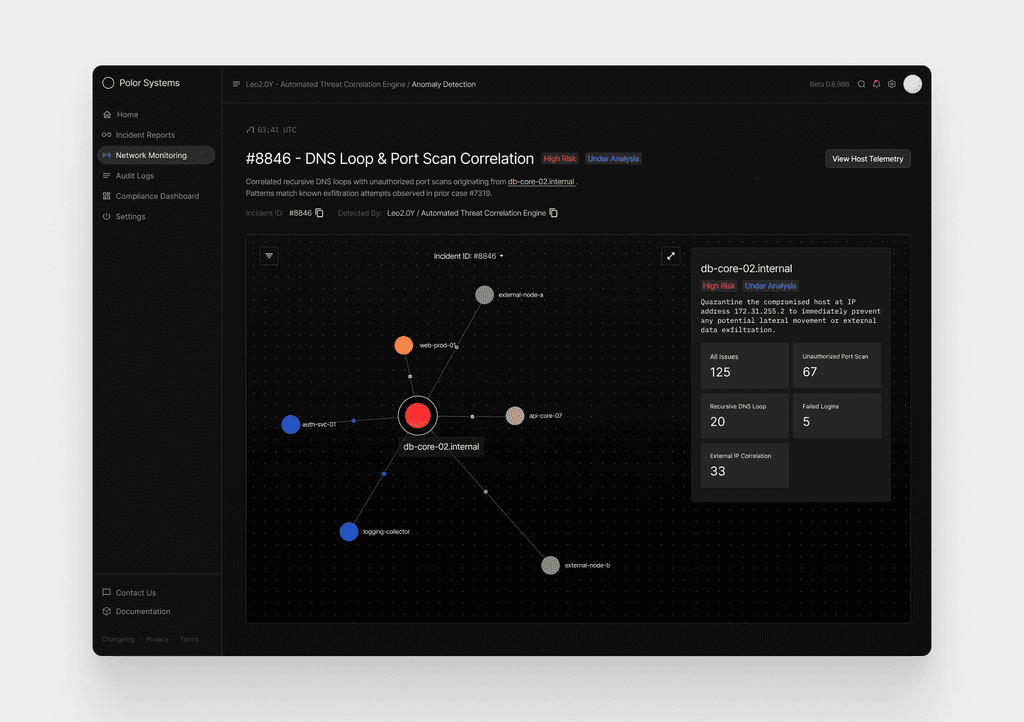
Node Graph (Anomaly Relationship Map)
Upon selecting Case #8846, the analyst is shown a dynamic relationship map centered around the affected host,
db-core-02.internal. The node appears larger and color-accented to indicate critical risk, with surrounding systems branching outward from it.
What the Graph Helps Explain
How the incident started and how activity propagated across systems
Lateral movement risk — whether internal services show signs of being probed or accessed
Correlation strength between systems, shown through node color and proximity
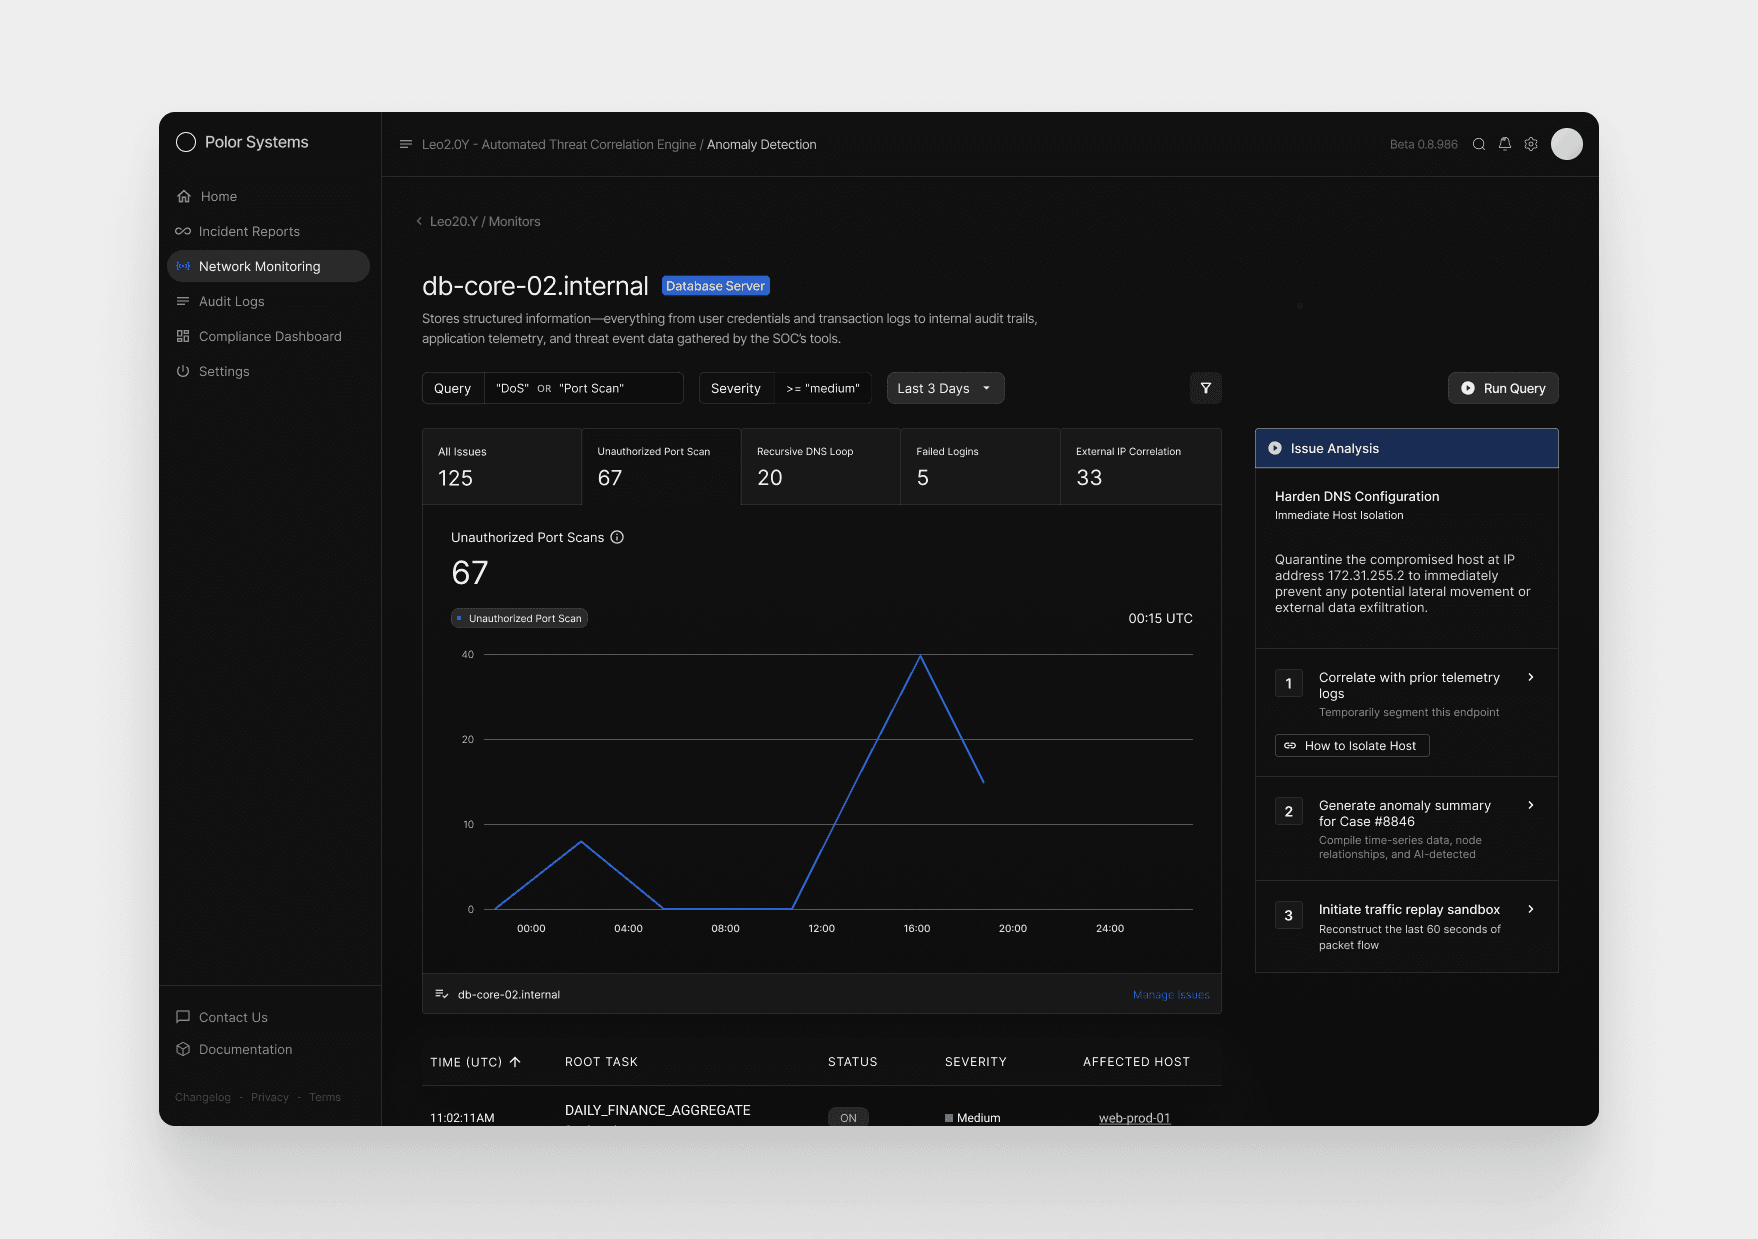
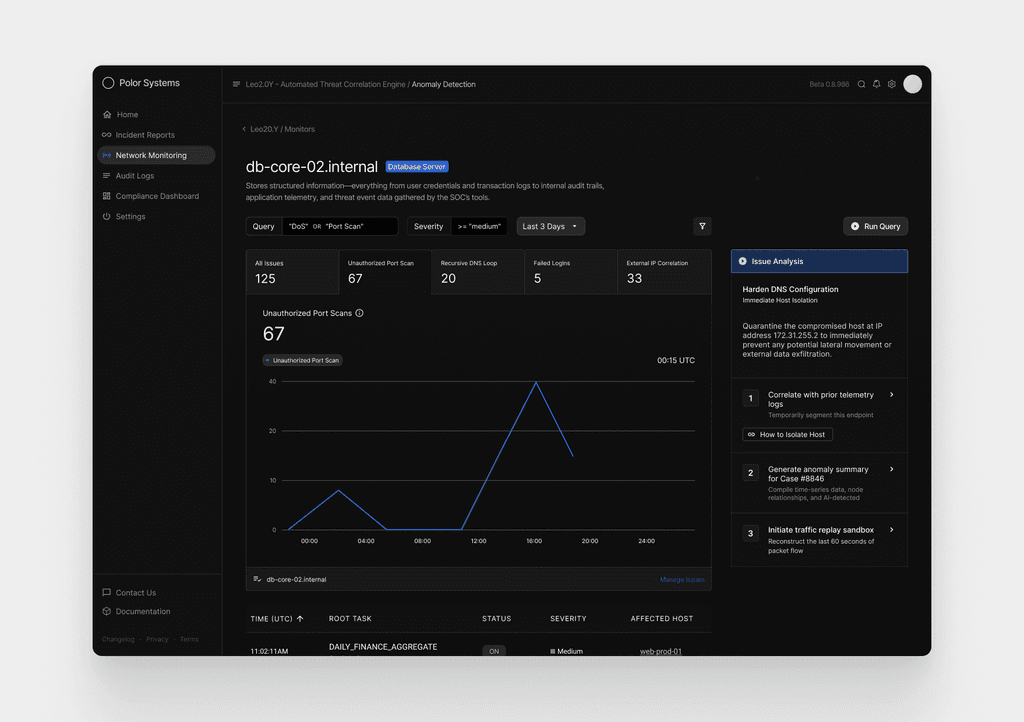
Detailed Host Insights + Remediation Actions
The final screen gives a focused look at activity from db-core-02.internal, using a time-based graph to show when the anomaly emerged and how it escalated. Spikes in port scans, DNS loops, and failed logins make it clear when the system came under pressure and how the pattern evolved throughout the day.
The system presents a focused set of solutions designed to help the analyst fully resolve Case #8846. These actions are generated by Leo2.0Y, based on the specific behaviors observed on db-core-02.internal.